

Southwest Economy, Second Quarter 2022

Banks in the region and the U.S., which have benefited from pandemic-era fiscal stimulus, face downside risks arising from Russia’s invasion of Ukraine, ongoing COVID-19 shocks abroad and expectations of significant central bank tightening to address elevated inflation. If a meaningful macroeconomic shock occurs, banks could face decelerating loan growth, deteriorating asset quality and declining earnings.
The challenges to banks are numerous: decelerating global growth, high inflation, potential structural economic change, significantly tighter central bank policy and high cybersecurity risks.
All these factors confront institutions in the Eleventh District and across the country.[1]
The sources of these factors resemble those clouding the broader economic outlook—Russia’s invasion of Ukraine and the continuing effects of the pandemic. Despite recent uncertainty, banks began 2022 on stronger footing and with a generally positive outlook.
Asset quality improved in 2021, with noncurrent loans as a share of total loans declining to lows not seen since before the 2008–09 financial crisis. Banks offered loan forbearance as part of the response to the pandemic which, combined with subsequent significant government stimulus, helped keep asset quality strong relative to prepandemic levels.
As a result, some banks reduced loan loss reserves, a move that boosted profitability last year. With asset quality at historically strong levels and a resumption of loan growth underway, it is unlikely banks will be able to further reduce loan loss reserves this year. Additionally, banks face significant hiring competition and wage pressures. These factors could further affect bank earnings this year.
Continued pressure on banks’ net interest margins is also likely to weigh on earnings.[2] Net interest margins trended lower and were near historic lows in 2021. Despite the Federal Reserve beginning a monetary policy tightening cycle in March 2022, with higher short-term rates benefiting margins, it’s likely margins will remain compressed as short-term rates are expected to increase more quickly than long-term ones.
In addition to raising the benchmark federal funds rate, the Federal Reserve began reducing the size of its balance sheet, which grew significantly during the financial crisis of the late 2000s and again in response to the COVID-19 economic downturn. Over time, reduction of the asset side of the Fed’s balance sheet will also decrease Federal Reserve liabilities, including banks’ reserves at the Federal Reserve.
Bank Profitability Rebounds
Profitability, as measured by return on average assets, recovered markedly in 2021.[3] Profitability was 1.33 percent for district banks in 2021, up 23 basis points (0.23 percentage points) from 2020, and 1.35 percent for U.S. banks, up 46 basis points (Chart 1).[4]
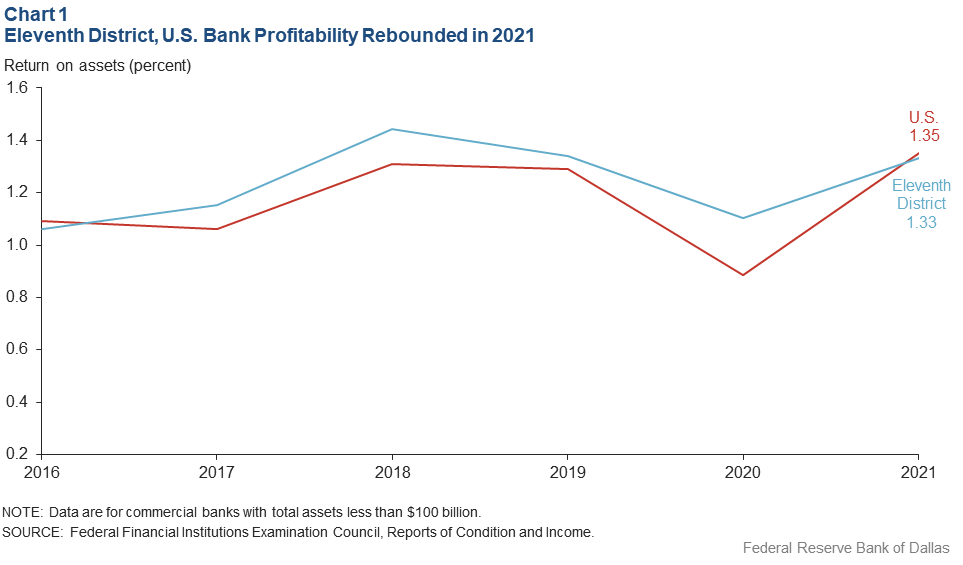
Releases from banks’ loan loss reserves together with lower noninterest expense offset declining revenue.
Both in the district and nationally, decreased provision for loan losses accounted for most of the improvement in profitability.[5] Provision expense went from historically reducing profitability to mildly supporting it in 2021, indicating a net release of loan loss reserves.
This was the first time since 1984—when the data began to be collected—that the U.S. banking industry in aggregate experienced negative provision expense. This is unlikely to continue. For district banks, reserve releases contributed 45 basis points to the improved return on average assets; nationally, it added 53 basis points.
Also contributing to profitability in 2021 was decreased noninterest expense—which includes employee salaries and benefits, operating expenses and expenses for premises. At district banks, noninterest expense was down 22 basis points to 2.20 percent of average assets, while nationwide noninterest expense fell 22 basis points to 2.40 percent.
In an environment of rising wages and with the need for greater investment in technology and IT security, noninterest expenses could rise.
Conversely, noninterest income was a drag on profitability. Despite noninterest income increasing in 2021—which anecdotally was partially attributable to fee income from the federal COVID-19 Paycheck Protection Program (PPP) relief loans that banks administered—it rose more slowly than average assets, thus reducing the return on average assets.
Net interest margins—at near historic lows in 2021—also weighed on bank profitability. At district banks, net interest margins fell 30 basis points to 2.92 percent of tax-equivalent average earning assets in 2021. Nationally, margins fell 16 basis points to 3.22 percent.
Despite Federal Reserve monetary policy tightening beginning in March 2022, margins will remain compressed this year because of Treasury curve flatness.[6] This is the result of a relatively small difference in the yield between short-term and long-term Treasury bonds. Banks take in deposits, paying a relatively low interest rate, and lend funds for longer terms at higher rates.
Banks seeking to boost net interest margins have increasingly invested in securities, including Treasuries, agency securities (bonds issued by federal government agencies and government-sponsored entities) and agency mortgage-backed securities.
Securities increased $42.5 billion for district banks in 2021—up 30.2 percent from 2020—and $367.8 billion nationwide in 2021, up 31.8 percent (Table 1). Growth in securities drove bank balance sheet expansion last year. Banks’ total assets—including loans, securities and reserve balances at the Fed—increased $70.8 billion (11.9 percent) in the district and $637.3 billion (10.2 percent) nationwide in 2021 compared with 2020.
Table 1: Fed Balances and Securities Drive Bank Balance Sheet Growth
| Change: Dec. 31, 2020–Dec. 31, 2021 | ||||
| Eleventh District banks | U.S. banks | |||
| Dollars (billions) | Percent | Dollars (billions) | Percent | |
| Total assets | 70.8 | 11.9 | 637.3 | 10.2 |
| PPP | -18.5 | -80.1 | -192.2 | -76.2 |
| Loans (excl PPP) | 17.8 | 5.7 | 283.0 | 7.4 |
| Securities | 42.5 | 30.2 | 367.8 | 31.8 |
| Balances at the Fed | 24.0 | 46.1 | 129.5 | 31.9 |
| Other interest bearing | 3.2 | 13.5 | 29.7 | 16.2 |
| Other | 1.8 | 4.4 | 19.5 | 4.3 |
| Total liabilities | 66.9 | 12.6 | 588.5 | 10.6 |
| Deposits | 73.7 | 14.8 | 662.6 | 12.8 |
| Wholesale funds | -6.8 | -38.9 | -68.9 | -27.7 |
| Other | na | na | -5.2 | -3.4 |
| Equity capital | 4.0 | 6.1 | 48.9 | 7.0 |
| NOTES: Data are for commercial banks with total assets less than $100 billion. PPP refers to the Paycheck Protection Program. Equity capital equals total assets minus total liabilities. The change from 2020 to 2021 is shown in both dollars and percent for Eleventh District and U.S. banks. SOURCE: Federal Financial Institutions Examination Council, Reports of Condition and Income. |
||||
Another driver of asset growth was reserve balances at the Fed, attributable to the central bank’s asset purchases and to stimulus funds moving from the U.S. Treasury to taxpayers, who, in turn, increased their deposit balances at banks.
However, as the Fed’s Federal Open Market Committee reduces the Fed’s balance sheet while tightening monetary policy, bank reserve balances at the Fed and consumer bank deposits are expected to decline. While this could marginally worsen banking liquidity, it could provide some relief to bank leverage ratios, weakened by double-digit balance sheet growth during the pandemic.[7]
Bank balance sheet expansion eased last year as government pandemic support to businesses and consumers ended, slowing deposit growth. Deposit growth driven by pandemic interventions peaked in early 2021. Deposits rose 27.1 percent year over year at district banks as of March 31, 2021, and 22.7 percent nationwide. Anecdotally, bankers reported that the PPP produced an inflow of retail and small business deposits.
By year-end 2021, deposit growth had slipped to 14.8 percent year over year in the district and 12.8 percent nationwide. Deposit growth is expected to continue slowing in 2022, as stimulus measures end.
District Loan Growth Uptick
Loan growth, disrupted by the pandemic, regained its footing in 2021. Loans among district banks grew 5.7 percent last year, versus 1.9 percent in 2020 (Chart 2). They increased 7.4 percent nationwide in 2021, compared with just below 2.0 percent the prior year.[8]
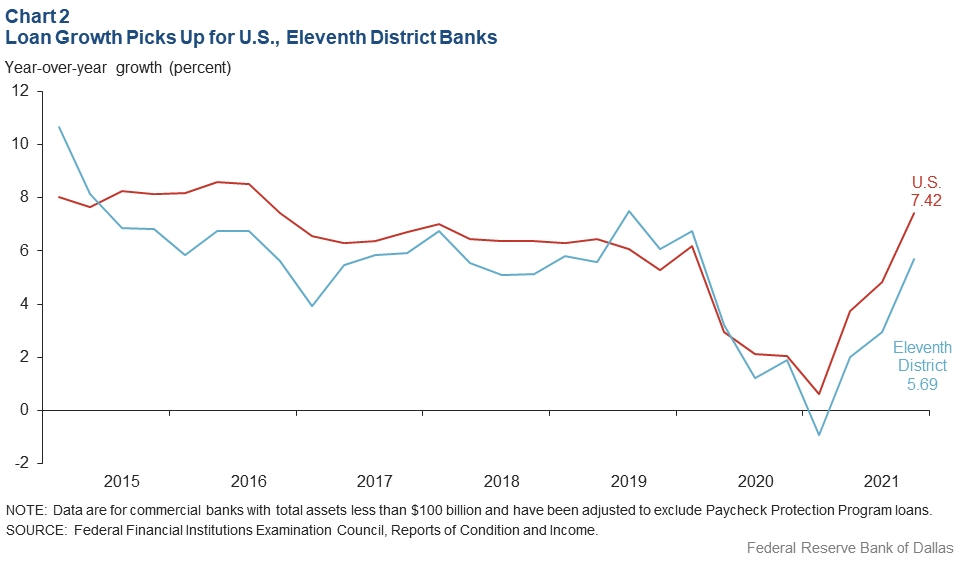
Loan growth has picked up this year, though banks will likely face strong competition for loans after tepid COVID-19-era performance.
Loan growth was broad based across major categories last year (Chart 3). Nationwide, commercial and industrial loan growth led the recovery in 2021 after becoming the slowest-growing category in 2020 as businesses took on PPP loans instead. The recent performance is indicative of businesses responding to the recovery with renewed borrowing to finance capital expenditures or restock inventories. Commercial and industrial loans rose 11.7 percent in the district and 12.6 percent nationwide in 2021.
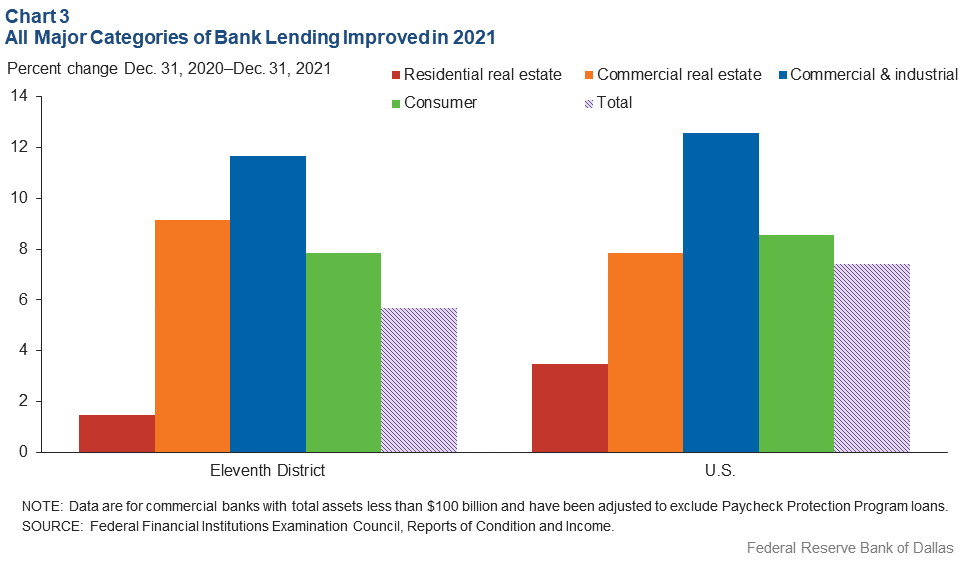
The strength of consumers and demand for housing boosted consumer and residential mortgage loan growth, while new construction and a gradual return of employees to offices supported expansion of the commercial real estate category. In the district, commercial real estate loans rose 9.1 percent, consumer loans increased 7.9 percent, and residential real estate loans grew 1.5 percent.
By comparison, nationwide, consumer loans rose 8.6 percent, faster than both commercial real estate, 7.9 percent, and residential real estate, 3.5 percent.
High concentrations of commercial real estate loans and their rapid growth have been historically associated with elevated risk of failures. Thus, banks’ commercial real estate activity bears monitoring. At year-end 2021, 17.4 percent of district banks had material concentrations in the sector, the highest percentage since 2006.[9]
Nationwide, 8.8 percent of banks had material concentrations in commercial real estate—close to a record high. While these loans are performing well, underlying property prices have been supported by a period of low interest rates and pandemic stimulus, and they bear watching as credit conditions evolve through the year.
Strong Asset Quality
Asset quality improved steadily in 2021 for banks in the district and nationwide, with noncurrent loans reaching levels last seen before the financial crisis in the late 2000s. Limited deterioration in asset quality during the pandemic was largely due to banks providing loan forbearance—including payment deferrals, fee waivers and extension of payment terms—under the Coronavirus Aid, Relief and Economic Security Act. The action allowed traditional measures of asset quality to remain strong and improve as borrowers largely resumed normal payments. The quick economic recovery as well as government stimulus also bolstered borrowers’ financial positions.
Across the district, 0.58 percent of loans at year-end 2021 were noncurrent—past due 90 days or more or on nonaccrual status (not generating interest)—down from 0.91 percent at the end of 2020 (Chart 4). Nationwide, noncurrent loans fell to 0.85 percent in 2021 from 1.17 percent. These are the lowest noncurrent loan values since 2007 for banks both in the district and nationwide.
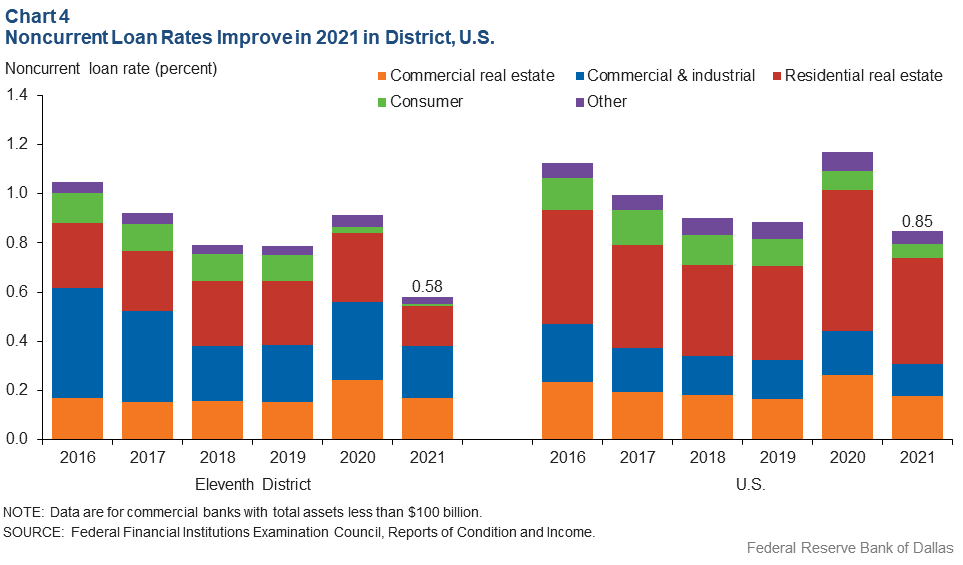
Of the major loan categories, residential real estate loans improved most in the district and nationwide.
Asset quality likely won’t improve further in 2022; it’s already near historic levels, loan growth is picking up, and the Russia–Ukraine war is clouding the economic outlook.
Uncertain Outlook
Significant public sector stimulus in response to the pandemic has produced an environment where asset quality is historically benign and loan growth is improving, even while there are strong headwinds to bank earnings, and banks’ commercial real estate concentrations are high.
Downside risks in the near term arise from the Russia–Ukraine conflict, recurring COVID-19 shocks abroad and expectations of significant central bank tightening to address elevated inflation. Should an economic downturn or other major macroeconomic shock occur, banks’ loan growth could decelerate, with asset quality deteriorating and earnings declining.
Notes
- The district comprises Texas, northern Louisiana and southern New Mexico.
- Net interest margin is the difference between a bank’s interest income (loan and securities yields) and interest expense (deposit and other borrowing costs) weighted by average earning assets.
- Bank profits consist of net interest income (interest income from loans and securities less interest paid on deposits and other borrowings) plus noninterest income (fees for services) less noninterest expense (salaries and benefits for employees). Profits also reflect gains or losses on the sale of securities and are reduced by provision expense (funds set aside to cover potential loan losses) and taxes.
- The existing analysis includes commercial banks with total assets less than $100 billion (over 99 percent of commercial banks nationwide and in district). Data for district banks have been adjusted for structure changes, such as mergers, acquisitions and relocations.
- Provision expense is the amount banks set aside to cover loan losses; provision expense gets added to a bank’s loan loss reserve, the buffer against expected losses. Reductions from the loan loss reserve—negative provision expense—boost profitability.
- The relationship between the slope of the Treasury, or
yield, curve and bank profitability as measured by net
interest margin remains intact, according to an analysis
in “Smaller Banks Less Able to Withstand Flattening Yield Curve,” by Pavel Kapinos and Alex Musatov, Federal Reserve Bank of Dallas Economic Letter, vol. 13,
no. 8, 2018. - Bank leverage ratios are a measure of a bank’s core capital relative to its total assets. A bank’s core capital includes assets that can be easily liquidated if the bank needs capital in the event of a large, unexpected loss or financial crisis.
- Loan growth values exclude PPP loans.
- “A bank has a material commercial real estate concentration if its: (1) total reported loans for construction, land development and other land represent 100 percent or more of their total capital; or (2) total commercial real estate loans represent 300 percent or more of their total capital, and the outstanding balance of their commercial real estate loans has increased by 50 percent or more during the prior 36 months.
About the Authors

Amy Chapel
Chapel is a macrosurveillance manager in the Banking Supervision Department at the Federal Reserve Bank of Dallas.

Kory Killgo
Killgo is a financial industry analyst in the Banking Supervision Department at the Federal Reserve Bank of Dallas.
Southwest Economy is published quarterly by the Federal Reserve Bank of Dallas. The views expressed are those of the authors and should not be attributed to the Federal Reserve Bank of Dallas or the Federal Reserve System.
Articles may be reprinted on the condition that the source is credited to the Federal Reserve Bank of Dallas.
Full publication is available online: www.dallasfed.org/research/swe/2022/swe2202.

